Charting and Trading Package Features
Active Trader Setups Trading Package Features


Specialize Charts and Standard Candle Charts
Proprietary Charts and Scanners
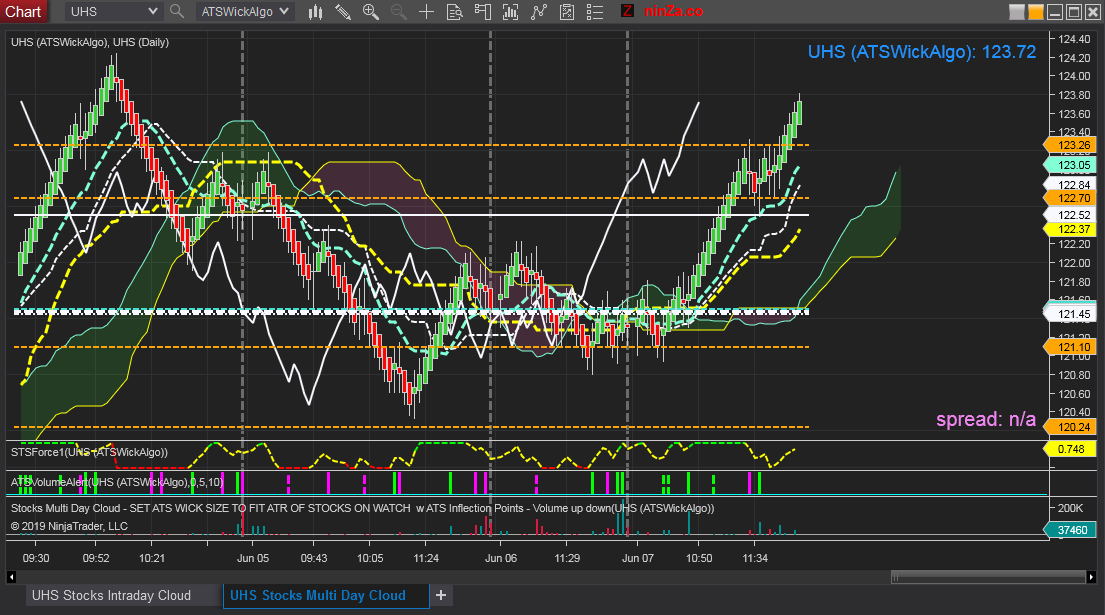
Trader's Choice Top Indicator - ATS Inflection Point Charts
Available in Multiple Chart and Candlestick Styles to fit Every Traders Preferences
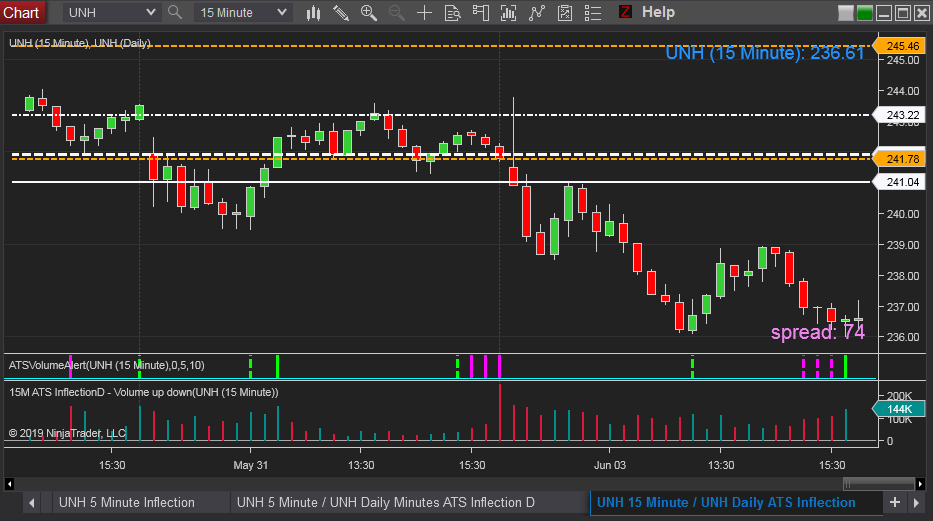
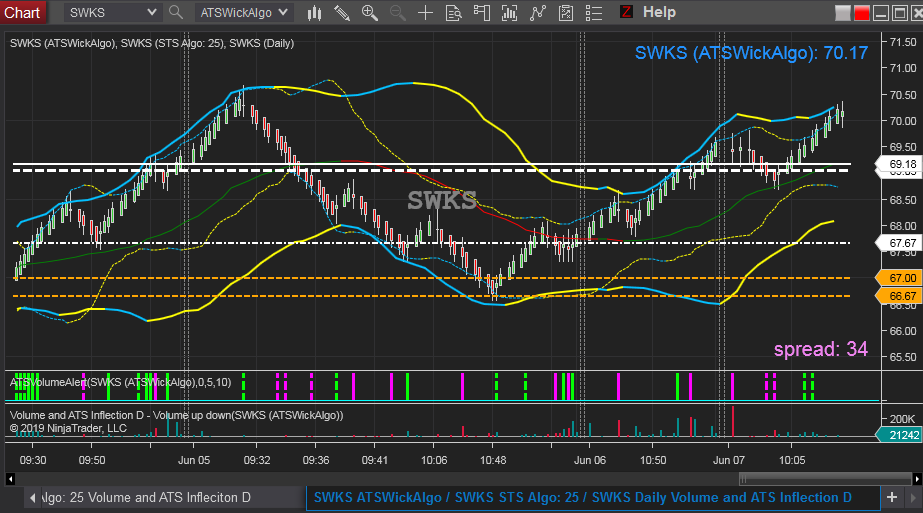
Complete with ATS Inflection Point and Key Level Cloud Scanners for Alerts to our Most Popular Trade Setups


ATS Bar Chart Trader
Active Trader Setups Trading Package
Sign up Today. Take advantage of FREE Education and Training Videos on our http://youtube.daytradersetups.com Education Channel. Complete Trading Package. Create your Trading Plan Today. Visit our Trader Members Area for in depth package content.
Trend Shift Pivot Zone
The Trading System charts are easy to read and distinguish bullish and bearish indicators. Our proprietary Trend Shift Pivot Zone changes color as the price triggers the trend shift. A pivot is a change of direction. Green color is a current or implied Up Trend and Red color is a current or implied Down Trend.
The upper left corner has a display box that shows the current algo plot price and the next plot level in either direction. The primary function is used with our Retracement Setups and the alert price is the trigger for probable resuming of the prevailing trend plot.
The lower left corner has a display box that appears when the Trend Shift could be changed and the trigger watch price is within 2 Algo Factor levels. (display box is not present if the possible shift is not projected)
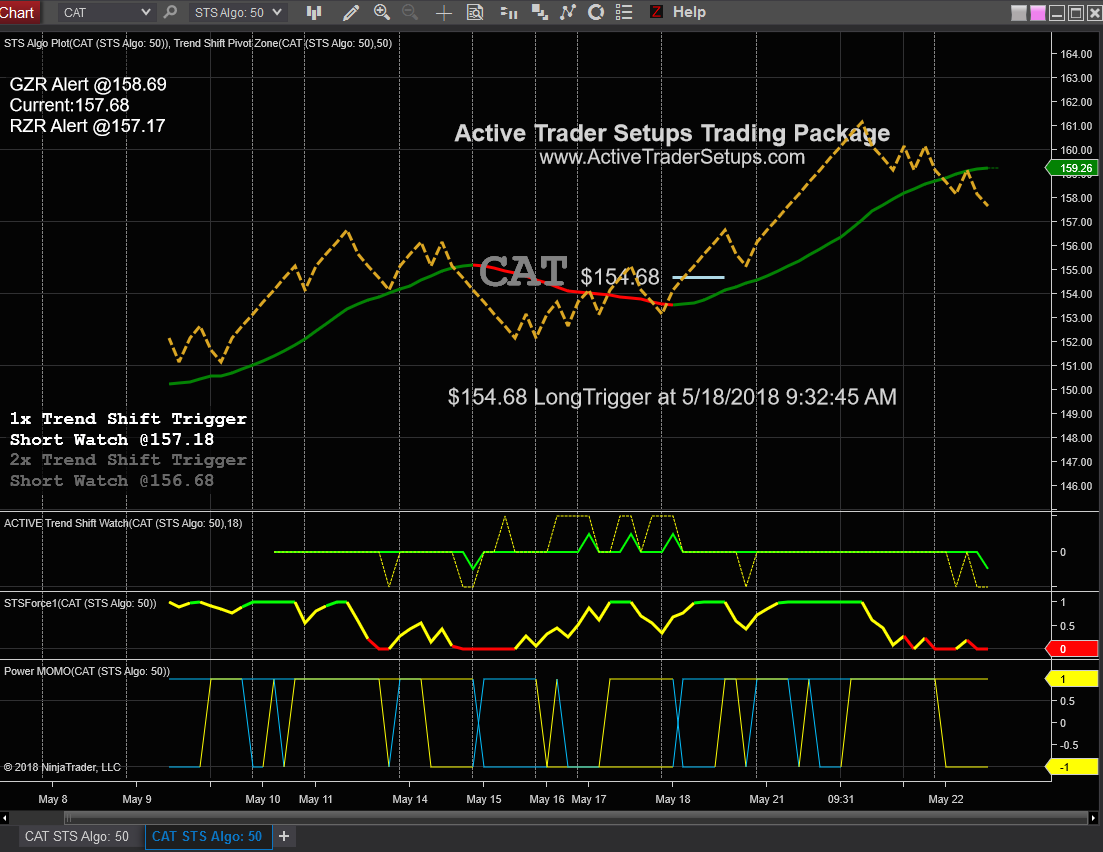
Our Proprietary System projects forward price action in both directions and predicts if the Trend will continue or change direction in advance of the change. When a change is projected the display box shows the 1x or 2x Trend Shift Trigger Watch Price. 1x is within 1 factor and the 2x is within 2 factors.
As the price action occurs in a tight range the projected price of a Trend Shift changes the trigger watch price.
Our custom Trend Shift Pivot Zone Indicator plot changes color to indicate the current Trend indicated by our Trading System. Easy to see the Trend at a glance. We also teach expected price action around the plot as the existing trend becomes in question.

Upper Left corner display box: Current Algo Price of last plot price.
GZR = Green Zone Retracement Alert Price (Price the Algo Plot will change directions - to indicate probable resuming of the current up trend.)
RZR = Red Zone Retracement Alert Price (Price the Algo Plot will change directions - to indicate probable resuming of the current down trend.)
Lower Left corner display box appears when active.
Projected Trend Shift Trigger Price (2x is between 1 and 2 factors from Watch Price
ACTIVE Trend Shift Watch (this indicator can be hidden on the charts), when the plots are upward or downward the display box appears with a Watch Price displayed that would indicate a change in Trend direction.

STSForce Strength indicates likely price continuation.

In Swing Trading using the appropriate Swing Trade Algo chart for the Trigger and referring to the next level up (larger factor chart) for the STSForce indicator to agree with the Trade Setup is helpful as well.)
Power Momentum Indicator - this Proprietary Indicator is used with our Algo Charts and with our Bull and Bear Zone Scanner alerts. This indicator when shifting from 2 yellow 1 to 2 Blue 1 simultaneously indicates momentum in the direction of a new breaking price action.


These indicators and be plotted separately or overlaid together to save screen space.


Each of these indicators can be scanned and alerted independently. Great for a focus watch list when you are waiting on a Trend Shift on small or large factor charts or when you are focused on a few stocks that you are waiting for a another small edge before entering your trade.
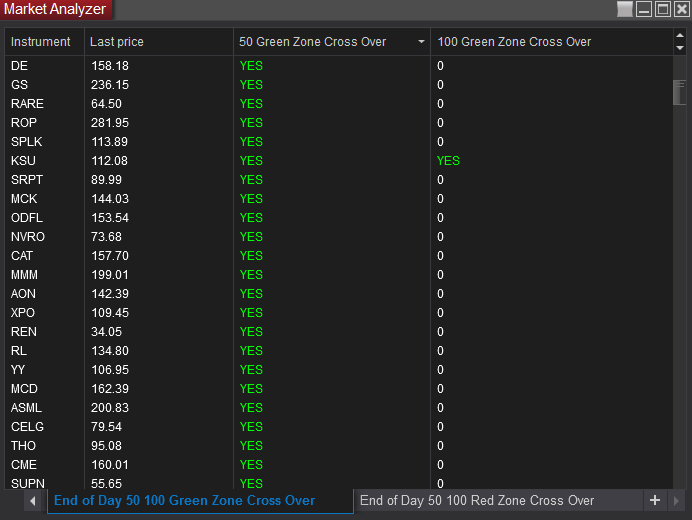
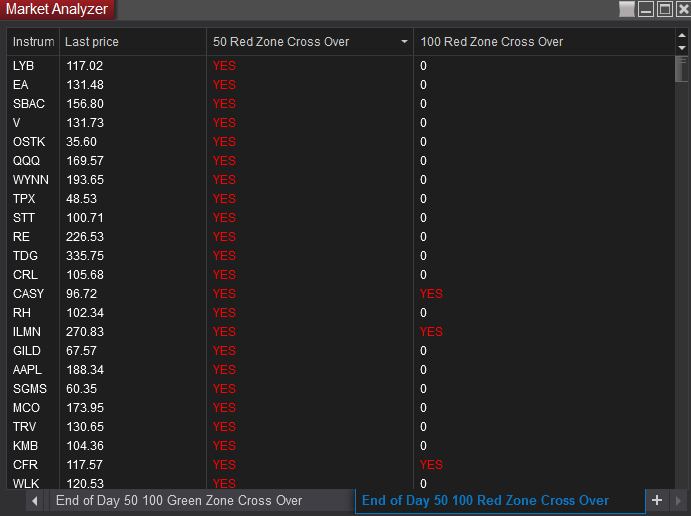
Scanners can only alert Trend Shift Cross overs as they occur Real Time. These custom End of Day Reports can be set up on for any factors for Traders Personal Watch List. They check the Today's close Trend Status compared to Yesterday close Trend Status and indicate YES if there was a Trend Shift during today's session.
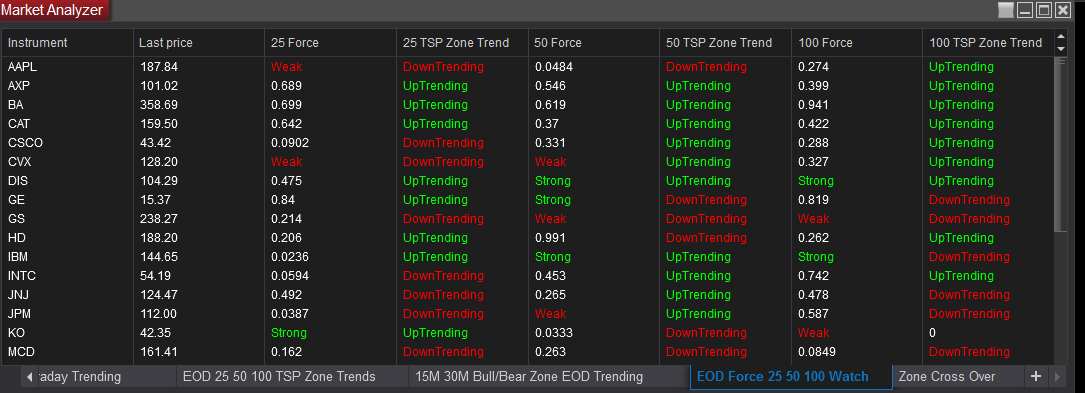
End of Day Reports comparing 25, 50, and 100 Factor Charts for Current Trend and Force Indicator to select stocks for trading considerations. Our Education and Training teach interpretation of these reports.
Standard Candles Charts and Scanners
Pre Built Charts
Short Term Support
Short Term Resistance
Inflection Points
VWAP
Open Price
Closing Price
Long Term Support
Long Term Resistance
Pre Built Scanners
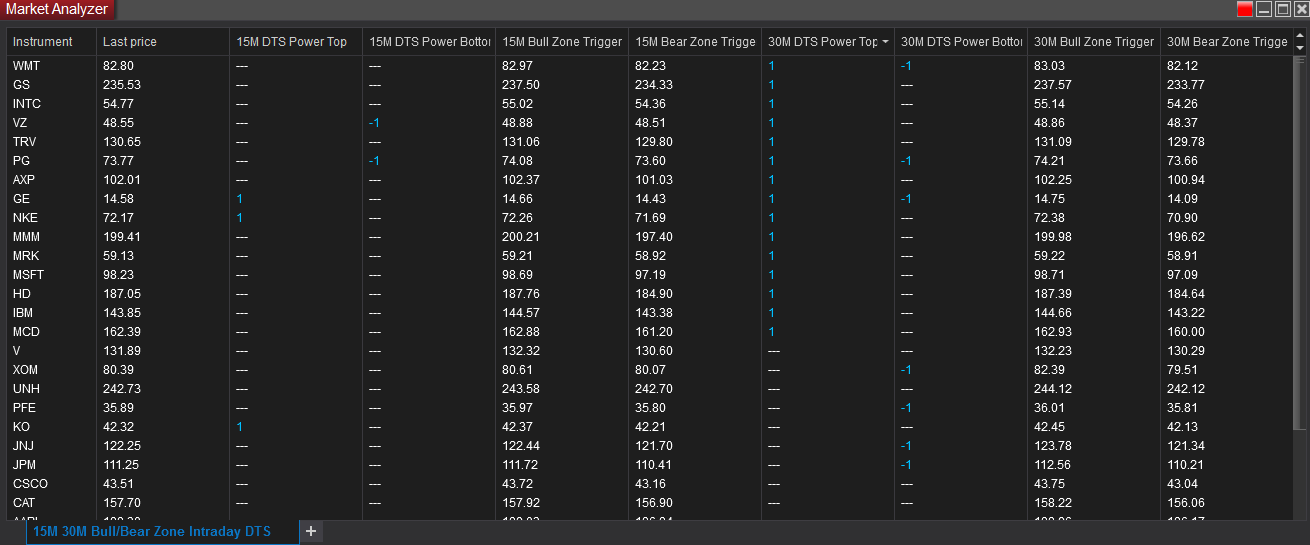
Proprietary Bull and Bear Zone Scanners
Scanners can be customize to Scan any Time Frame
Pre Built 10M, 15m, and 30M Bull and Bear Zone
Pre Built Daily and Weekly Bull and Bear Zone
Proprietary Algo Trends Combined with Bull and Bear Zone Indicators
Pre Built 10 Minute Bull/Bear Zone Scanners with Added Algo Trends
Bull Zone and Bear Zone Chart
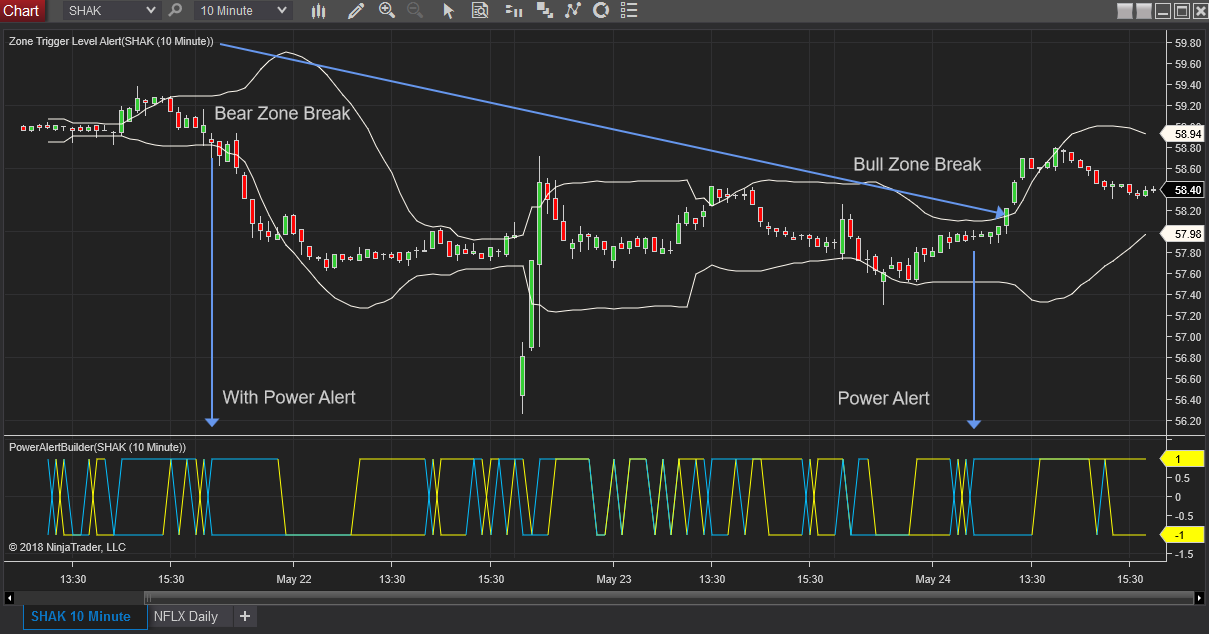
The Bull Zone and Bear Zone break chart and Scanners can be used on any time frame charts 5 minute, 10 minute, Daily, or Weekly.
The preferred condition is a consolidation break accompanied by Power Momentum Alert shift to 2 Blue 1's. The Power Momentum can be used independently as well.
Pre Built NinjaTrader Scanners for the Bull and Bear Zone Alerts on many time frames from 10M through Weekly Charts
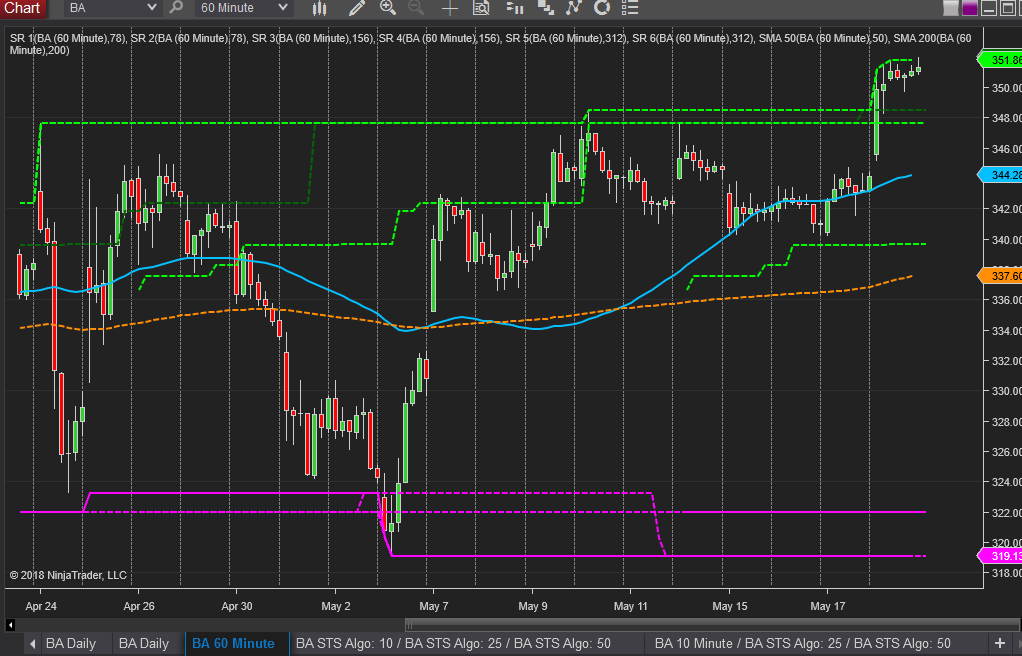
Long Term Support and Resistance Plots. These plots work on all time frames and will plot shorter or longer term support and resistance based on the time frame of the chart.
A 5 Minute chart will plot the last few days highs and lows. A 15 minute chart will plot 3 to 6 days back. A 30 Minute chart will plot 6 to 12 days back. The bigger the time frame the longer term the support and resistance plots.
As a Subscriber to our Service and Chart Trading Setups Members acknowledge their responsibility to perform Due Diligence of stocks featured. We are not financial advisers and we perform NO Fundamental Analysis. We are only Price Action and Momentum driven in our Trading Charts and Price Alert Watch Triggers.
SPECIAL CAUTION should always be given to stocks about to have earnings releases and we recommend NOT being in a short term swing trade into a Earnings Release. At the same time using our Trading Package and Charting indicators can prepare you for the after Earnings Release Trade Setups. Subscribers also Acknowledge awareness of News and Chatter Effects on Stock Prices.
Active Trader Setups Trading Package
Sign up Today. Take advantage of FREE Education and Training Videos on our http://youtube.daytradersetups.com Education Channel. Complete Trading Package. Create your Trading Plan Today. Visit our Trader Members Area for in depth package content.


